Included components#
Text#
Text component is the simplest component. It can be used to display a message:
from dashboards.component import Text
from dashboards.dashboard import Dashboard

class ExampleDashboard(Dashboard):
    text_example = Text(value="Rendered on load")
    html_example = Text(
        value="<strong>HTML also rendered on load</strong>",
        mark_safe=True,
    )
The Text component can render either plain text or HTML with the addition of the mark_safe=True attribute.
Stat#
Stat is simply a more controller version of Text, with a little more styling/layout applied to the template:
from dashboards.component import Text
from dashboards.component.text import StatData
from dashboards.dashboard import Dashboard

class ExampleDashboard(Dashboard):
    stat_one = Stat(
        value=StatData(text="100%", sub_text="increase")
    )
    stat_two = Stat(
        value=StatData(text="88%", sub_text="decrease", change_by="12%"),
    )
Text will be the main value and sub_text appearing below, change_by and change_by_text can
also be used to display additional information.
Note
that StatData is a convenience class, a dict would also work.
Chart#
Charts are displayed front end with plotly.js - a component simply needs to return valid json representation of a plotly chart to the component.
The simplest way to do this is with Plotly Express.
from dashboards.component import Chart
from dashboards.dashboard import Dashboard

import plotly.express as px

def get_bubble_chart(*args, **kwargs):
    df = px.data.iris()
    fig = px.scatter(
        df,
        x="sepal_width",
        y="sepal_length",
        size="petal_length",
        color="species",
    )
    fig = fig.update_traces(mode="markers")
    return fig.to_json()


class ExampleDashboard(Dashboard):
    bubble_chart_example = Chart(defer=get_bubble_chart)
However, you can also leverage our ChartSerializer to make this more concise and reusable. For example if we had
from typing import Optional

import plotly.express as px
import plotly.graph_objs as go

from dashboards.component.chart import ChartSerializer

class ScatterChartSerializer(ChartSerializer):
    x: Optional[str] = None
    y: Optional[str] = None
    size: Optional[str] = None
    color: Optional[str] = None
    mode: Optional[str] = "markers"

    def apply_layout(self, fig: go.Figure):
        fig = super().apply_layout(fig)
        return fig.update_layout(
            template="plotly_dark",
            plot_bgcolor="rgba(0,0,0,0.05)",
            paper_bgcolor="rgba(0,0,0,0.05)",
        )

    def get_x(self, df) -> str:
        return self.x

    def get_y(self, df) -> str:
        return self.y

    def get_size(self, df) -> str:
        return self.size

    def to_fig(self, df) -> go.Figure:
        fig = px.scatter(
            df,
            x=self.get_x(df),
            y=self.get_y(df),
            size=self.get_size(df),
            color=self.color,
        )
        fig = fig.update_traces(mode=self.mode)

        return fig


class ExampleBubbleChartSerializer(ScatterChartSerializer):
    x = "sepal_width"
    y = "sepal_length"
    color = "species"
    size = "petal_length"

    class Meta:
        title = "Bubble Chart Example"

    def get_data(self, *args, **kwargs):
        return px.data.iris()
We can then call the serializer with:
from dashboards.component import Chart
from dashboards.dashboard import Dashboard

class ExampleDashboard(Dashboard):
    bubble_chart_example = Chart(
        defer=ExampleBubbleChartSerializer
    )
Note
In this example, we use apply_layout to make the chart use a dark theme, you can make your own classes/mixins to apply this globally.
Both versions produce the same base chart:
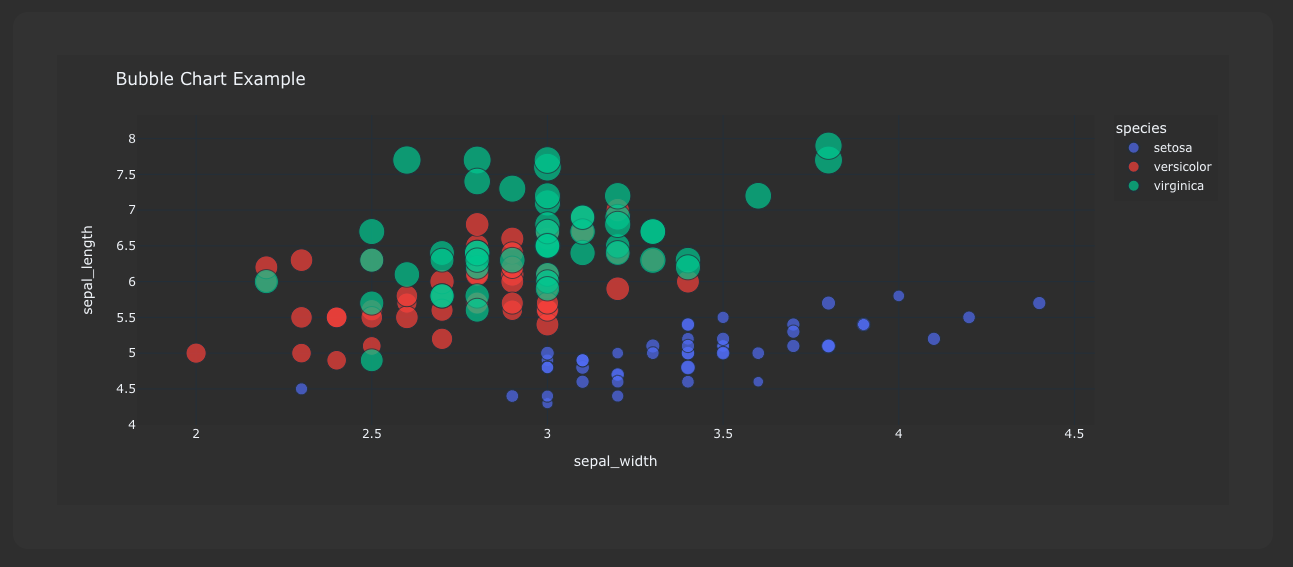
Chart serializers also come with other benefits like ORM integration, empty chart generation, the ability to apply common layouts etc. For more examples please see the Chart Serializers docs.
Map#
Maps are also displayed front end with plotly.js - a component simply needs to return valid json representation of a plotly map or mapbox map to the component.
import json
from dashboards.component import Map
from dashboards.dashboard import Dashboard

def fetch_scatter_map_data(*args, **kwargs):
    return json.dumps(
        dict(
            data=[
                dict(
                    lat=[40.7127, 51.5072],
                    lon=[-74.0059, 0.1275],
                    mode="lines",
                    type="scattergeo",
                    line={"width": 2, "color": "blue"},
                )
            ],
            layout=dict(
                title="London to NYC Great Circle",
                showlegend=False,
                geo={
                    "resolution": 50,
                    "showland": True,
                    "showlakes": True,
                    "landcolor": "rgb(204, 204, 204)",
                    "countrycolor": "rgb(204, 204, 204)",
                    "lakecolor": "rgb(255, 255, 255)",
                    "projection": {"type": "equirectangular"},
                    "coastlinewidth": 2,
                    "lataxis": {
                        "range": [20, 60],
                        "showgrid": True,
                        "tickmode": "linear",
                        "dtick": 10,
                    },
                    "lonaxis": {
                        "range": [-100, 20],
                        "showgrid": True,
                        "tickmode": "linear",
                        "dtick": 20,
                    },
                },
            ),
        )
    )

class ExampleDashboard(Dashboard):
    scatter_map_example = Map(defer=fetch_scatter_map_data)
Because Map is just an extension of Chart you can also leverage plotly express and ChartSerializer to render maps.
# dashboards.py
from typing import Optional, List

import plotly.express as px
import plotly.graph_objs as go

from dashboards.component.chart import ChartSerializer
from dashboards.component import Map
from dashboards.dashboard import Dashboard


class ChoroplethMapSerializer(ChartSerializer):
    locations: List[str]
    locationmode: Optional[str] = "USA-states"
    color: Optional[List[int]] = None
    scope: Optional[str] = "usa"

    def get_data(self, *args, **kwargs):
        return dict(
            locations=self.locations,
            locationmode=self.locationmode,
            color=self.color,
            scope=self.scope,
        )

    def to_fig(self, data) -> go.Figure:
        fig = px.choropleth(
            **data
        )

        return fig


class ExampleMapSerializer(ChoroplethMapSerializer):
    locations = ["CA", "TX", "NY"]
    color = [1, 2, 3]

    class Meta:
        title = "Example Choroplet Map"


class ExampleDashboard(Dashboard):
    map_example = Map(defer=ExampleMapSerializer)
Here are the two components side by side:
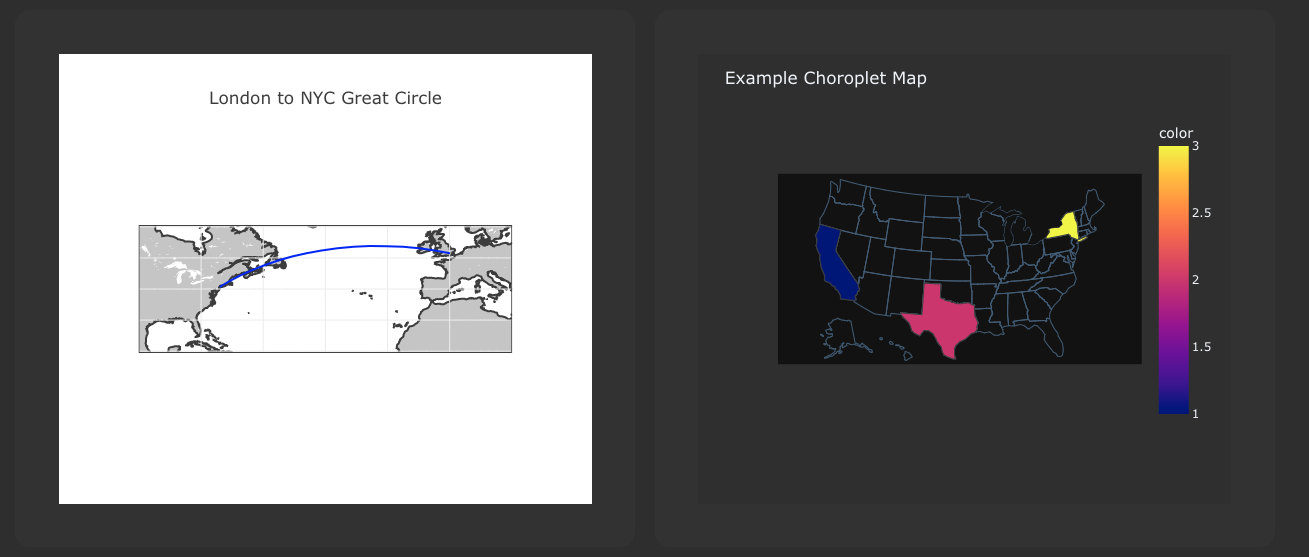
Using Chart serializers comes with other benefits such as ORM integration, empty chart generation, the ability to apply common layouts etc. For more examples please see the Chart Serializers docs.
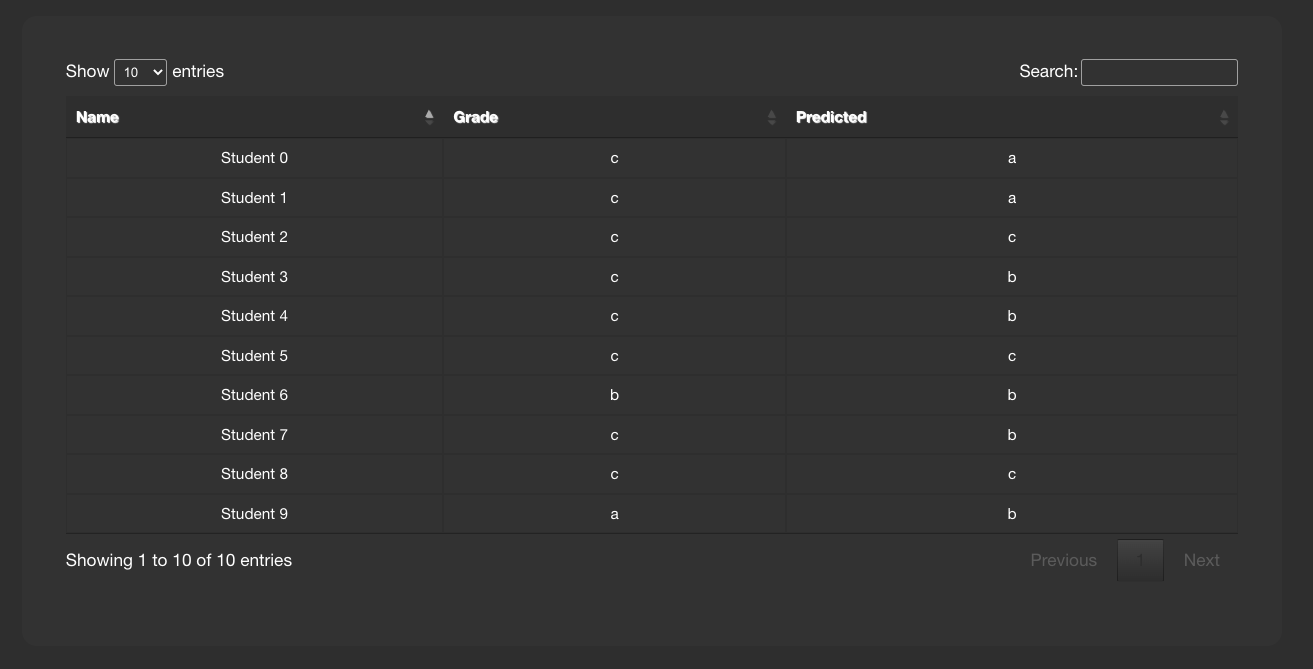
Table#
To make tables easier to add to a component, you can subclass TableSerializer and pass it’s serialize function directly to defer or value. This will give you a searchable and sortable table datatables.js component:
import random

from dashboards.component import Table
from dashboards.dashboard import Dashboard
from dashboards.component.table import TableSerializer
from dashboards.registry import registry


class StudentSerializer(TableSerializer):
    class Meta:
        title = "Students"
        columns = {
            "name": "Name",
            "grade": "Grade",
            "predicted": "Predicted",
        }

    @staticmethod
    def get_data(filters, **kwargs):
        students = [
            {
                "name": f"Student {r}",
                "grade": random.choice(["a", "b", "c"]),
                "predicted": random.choice(["a", "b", "c"]),
            }
            for r in range(10)
        ]
        # apply grade filter if available
        if filters and "grade" in filters and filters["grade"] != "all":
            students = list(filter(lambda x: x["grade"] == filters["grade"], students))

        return students


class StudentDashboard(Dashboard):
    student_table = Table(value=StudentSerializer, grid_css_classes="span-12")

    class Meta:
        name = "Students"


registry.register(StudentDashboard)
Serializer can also be driven directly from Meta.model or defining a get_queryset(obj) method:
class StaffSerializer(TableSerializer):
    class Meta:
        title = "Staff table"
        columns = {
            "id": "ID",
            "first_name": "First Name",
        }
        order = ["-first_name", "id"]
        # model = User

    @classmethod
    def get_queryset(cls, **kwargs):
        """
        kwargs are passed through from value/defer as above
        """
        return User.objects.filter(is_staff=True)
You can also customise any of the columns in the serializer via get_FOO_value:
class StaffSerializer(TableSerializer):
    ...

    @staticmethod
    def get_first_name_value(obj):
        return obj.first_name.upper()

    ...
Additional Table attributes:
page_size(int-default=10): set the paging sizesearching/paging/ordering(bool-default=True): enable/disable relevant datatables features.
Additional TableSerializer Meta attributes
first_as_absolute_url(bool-default=False): if the model or object has a get_absolute_url use it in the first column.force_lower- (bool-default=True): forces searching and sorting of data to use lower values.order- (list): list of fields from columns to order by, prefix with - for descending.
BasicTable#
Basic tables work the same as table, with the js, search & sort disabled.
table_example_not_deferred = BasicTable(
    value=ExampleTableSerializer,
)
Form#
The Form component allows you to add forms to your dashboard.
There are a number of reasons why you may want to do this, such as: adding filtering
or including a form to create an object.
To include a form in your Dashboard simple add a Form component and pass
a DashboardForm instance as the form attribute. A DashboardForm is
a normal Django Form with some additional helper methods.
As well as the form you can pass some optional attributes to control how it functions:
css_classes(dict): Allows you to change the default css class forform,tableandbuttonform(DashboardForm): The Form to rendermethod(str): whether to submit the form as a GET or a POSTtrigger(str): what triggers a change. Can bechangeorsubmitsubmit_url(str): url the form submits to.
from django import forms

from dashboards.component import Form
from dashboards.dashboard import Dashboard
from dashboards.forms import DashboardForm

class GradeForm(DashboardForm):
    grade = forms.ChoiceField(
        choices=(
            ("all", "All"),
            ("a", "A"),
            ("b", "B"),
            ("c", "C"),
        )
    )

class GradeDashboard(Dashboard):
    grade_form = Form(
        form=GradeForm,
    )
This creates a form with a single dropdown with grades form A-C shown.
You could also create a form that adds a student:
class AddStudentForm(DashboardForm):
    name = forms.CharField(required=True)
    final_grade = forms.ChoiceField(
        choices=(
            ("a", "A"),
            ("b", "B"),
            ("c", "C"),
        )
    )

    def save(self):
        global student_list

        student_list.append(
            {
                "name": self.cleaned_data["name"],
                "grade": self.cleaned_data["final_grade"],
            }
        )
Dependents and add Form#
All components accept a dependents list, these are other components that will update when the component changes or is actioned. A good use case for this is a dashboard like the above a filter which updates the table.
import random
from django import forms

from dashboards.component import Table
from dashboards.dashboard import Dashboard
from dashboards.component import Form
from dashboards.forms import DashboardForm
from dashboards.component.table import TableSerializer
from dashboards.registry import registry


class StudentSerializer(TableSerializer):
    class Meta:
        title = "Students"
        columns = {
            "name": "Name",
            "grade": "Grade",
            "predicted": "Predicted",
        }

    @staticmethod
    def get_data(filters, **kwargs):
        students = [
            {
                "name": f"Student {r}",
                "grade": random.choice(["a", "b", "c"]),
                "predicted": random.choice(["a", "b", "c"]),
            }
            for r in range(10)
        ]
        # apply grade filter if available
        if filters and "grade" in filters and filters["grade"] != "all":
            students = list(filter(lambda x: x["grade"] == filters["grade"], students))

        return students


class GradeForm(DashboardForm):
    grade = forms.ChoiceField(
        choices=(
            ("all", "All"),
            ("a", "A"),
            ("b", "B"),
            ("c", "C"),
        )
    )


class StudentDashboard(Dashboard):
    grade_form = Form(
        form=GradeForm,
        method="get",
        dependents=["student_table"],
        grid_css_classes="span-12"
    )
    student_table = Table(value=StudentSerializer, grid_css_classes="span-12")

    class Meta:
        name = "Students"


registry.register(StudentDashboard)
You will notice dependents has been set as an attribute on the Form component.
If populated, this refreshes all components listed when the form is changed.
In the example above, student_table will be refreshed when the grade_form
changes.
As well as reloading the component, all form data is automatically passed into
the get_data() method of the TableSerializer when the form is changed.
In the example we use this to filter down the students based on the grade selected.
You may also want to add a form which creates data and updates the table. This can also
be achieved following the same process but with an additional save() method
on the DashboardForm to define how to create the data. When doing this type
of form you will also want to pass method="post" and trigger="submit" into
the Form component.
Below is a full example how to create a dashboard that achieves this.
import random
from django import forms

from dashboards.component import Table
from dashboards.dashboard import Dashboard
from dashboards.component import Form
from dashboards.forms import DashboardForm
from dashboards.component.table import TableSerializer
from dashboards.registry import registry


# For example purposes! Store your data in the ORM or elsewhere!
students = [
    {
        "name": f"Student {r}",
        "grade": random.choice(["a", "b", "c"]),
        "predicted": random.choice(["a", "b", "c"]),
    }
    for r in range(10)
]

class StudentSerializer(TableSerializer):
    class Meta:
        title = "Students"
        columns = {
            "name": "Name",
            "grade": "Grade",
            "predicted": "Predicted",
        }

    @staticmethod
    def get_data(filters, **kwargs):
        # apply grade filter if available
        students_list = students
        if filters and "grade" in filters and filters["grade"] != "all":
            students_list = list(filter(lambda x: x["grade"] == filters["grade"], students))

        return students_list


class GradeForm(DashboardForm):
    grade = forms.ChoiceField(
        choices=(
            ("all", "All"),
            ("a", "A"),
            ("b", "B"),
            ("c", "C"),
        )
    )


class AddStudentForm(DashboardForm):
    name = forms.CharField(required=True)
    final_grade = forms.ChoiceField(
        choices=(
            ("a", "A"),
            ("b", "B"),
            ("c", "C"),
        )
    )

    def save(self):
        students.append(
            {
                "name": self.cleaned_data["name"],
                "grade": self.cleaned_data["final_grade"],
            }
        )


class StudentDashboard(Dashboard):
    grade_form = Form(
        form=GradeForm,
        method="get",
        dependents=["student_table"],
        grid_css_classes="span-6"
    )
    add = Form(
        form=AddStudentForm,
        method="post",
        trigger="submit",
        css_classes={"btn": "btn btn-primary"},
        dependents=["student_table"],
        grid_css_classes="span-6"
    )
    student_table = Table(value=StudentSerializer, grid_css_classes="span-12")

    class Meta:
        name = "Students"


registry.register(StudentDashboard)
Notice that we are updating a global variable for student_list in this example
but in real life you could do this with a django Model instead.